
Update, Nov. 2020: Since writing this post, AWS released a new feature that allows you to export data directly from DynamoDB to S3. This eliminates the need to do a manual export or write a Lambda function to scan your DynamoDB table and put the data in S3. For a one-time export, this is a great solution. For my use case of automated weekly snapshots, I'm still using the solution described in this post since I need the EventBridge scheduled event to trigger the weekly snapshot.
When I wanted to use QuickSight to visualize data from one of my applications, I was initially surprised to find that DynamoDB isn't one of the natively supported data sources like Redshift, S3, RDS, and others. This makes sense, since DynamoDB is optimized for transactional queries, not running analytical queries.
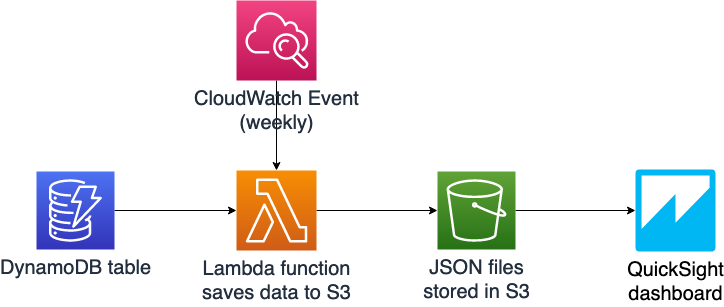
In order to run analytics on DynamoDB data with QuickSight, I needed to pipe the data out of DynamoDB. To do this, I built a simple data pipeline with Lambda, EventBridge scheduled events, and S3.
Note: This approach works well for a small application like mine (in the hundreds or thousands of rows of data). At greater scale there are more optimal and cost effective ways to do reporting, like setting up DynamoDB Streams to only export changes in your data, as opposed to doing a full DynamoDB table scan each week.
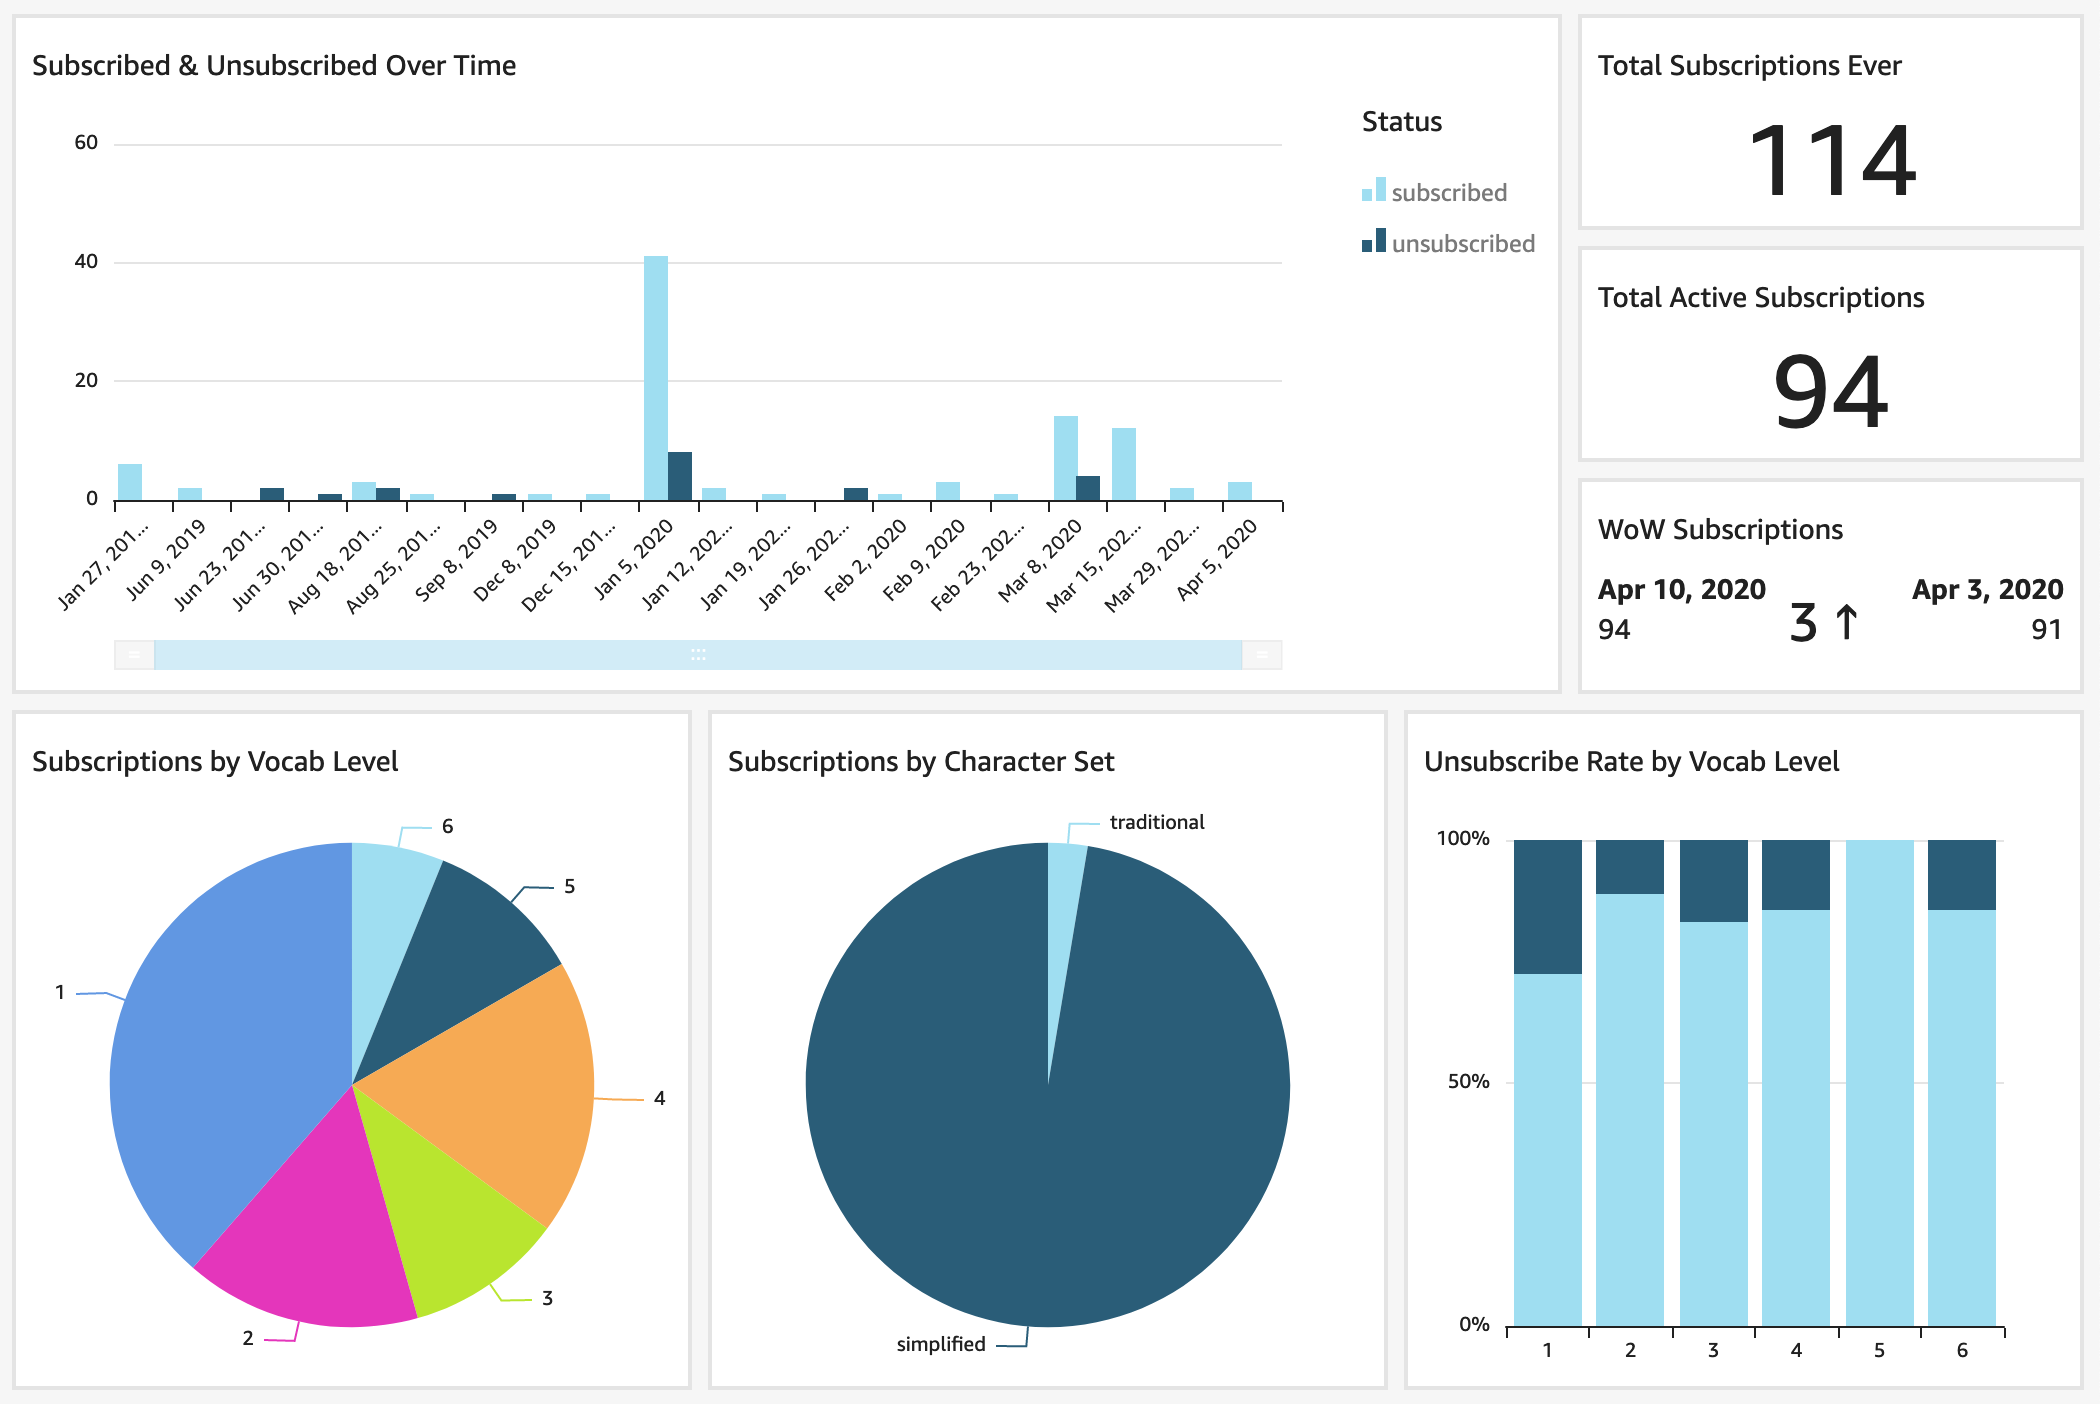
The finished product is this QuickSight dashboard. It shows my Chinese vocab app subscribers over time and by what level they're subscribed to.
Jump to:
How it's built
I want to see data on a weekly basis, so I set up an EventBridge scheduled event to run on a weekly cadence.
This event triggers a Lambda function (code below) which scans the DynamoDB table and reads the data into an array. The function appends the current date to each row of data, so that I can filter my dashboards by reporting data and see changes over time. Finally, the data is saved as a JSON file in S3 with the current date as the file name.
I'm including my Lambda and EventBridge scheduled event definition in my infrastruture as code template (SAM template below). I created my S3 bucket in the AWS console.
When at least one JSON data file is saved in S3, head into the QuickSight console and select S3 as a data source (Manage Data -> New data set -> S3). QuickSight asks for a manifest file where you specify which bucket or specific S3 file you're selecting as your data source and what format the data is in. Check out mine below, where I've put my bucket name and indicated that I'm using JSON data files.
And voila, you can now play with your data in QuickSight. I like the ability to create calculated fields (Manage Data -> Edit data set) to clean up my data labels for display. Remember to filter by ReportingDate within the last 7 days, because otherwise you'll get aggregate data for all the weekly files in your S3 bucket.
Code samples:
Lambda function code:
SAM template:
QuickSight manifest:
🌻